Market Report: Surviving the November 2025 Bitcoin Correction

The cryptocurrency markets, historically defined by their cyclical nature and high volatility, entered a phase of profound dislocation in the fourth quarter of 2025. Following a period of euphoric price discovery in early October—where Bitcoin (BTC) established a new all-time high above $126,000—the digital asset ecosystem has undergone a violent and systemic repricing.
This report serves as an exhaustive analysis of the market mechanics, macroeconomic catalysts, and structural failures that precipitated the collapse of Bitcoin to a seven-month low near $81,000 in November 2025. The drawdown has erased nearly $800 billion in Bitcoin market capitalization and over $1.2 trillion from the broader digital asset sphere, representing the most severe monthly contraction since the contagion events of 2022.
While headline declines of 20-30% are not unprecedented, the microstructure of this crash reveals new vulnerabilities. It was not a singular “black swan” but a “Liquidity Singularity.” This phenomenon, often described as terminal market reflexivity, occurred when institutional profit-taking converged with the forced unwinding of circular lending schemes, overwhelming the market’s capacity to absorb the shock.
I. The Scale of Destruction: Quantifying the Collapse
To contextualize the severity of the November rout, one must examine the raw destruction of value. As of November 21, Bitcoin had surrendered all gains accrued throughout the calendar year 2025, effectively resetting the market to its pre-rally state. The velocity of the decline was particularly notable; a weekly drop exceeding 12% signaled a total capitulation of the “buy the dip” mentality that had pervaded the market for the previous eighteen months.
Key Market Metrics (October–November 2025)
- Peak Price (Oct 2025): ~$126,000 — The cycle high marking the peak of “Uptober” euphoria.
- Trough Price (Nov 2025): ~$80,553 — A 7-month low, erasing year-to-date profitability.
- Monthly Decline: > 23% — The steepest monthly slide since the June 2022 deleveraging.
- Total Market Cap Loss: ~$1.2 Trillion — A loss of wealth exceeding the GDP of major nations.
- Liquidations (Peak): $2.2 Billion (24h) — Primarily long positions forced closed by exchange engines.
The destruction was not limited to Bitcoin. The broader altcoin market suffered disproportionately, with assets like Ethereum tumbling to four-month lows. For merchants utilizing a crypto ecommerce platform, this volatility underscored the necessity of instant settlement tools to mitigate currency risk during such drastic downturns.
II. The Precursor: The Geopolitical Shock of October 10
To fully understand the mechanics of the November collapse, it is essential to analyze the “tremor” that fractured the market’s foundation a month prior. On October 10, 2025, a geopolitical shock fundamentally altered the risk profile of global assets.
The Trump Tariff Announcement
The catalyst was a policy announcement by U.S. President Donald Trump regarding a 100% tariff on Chinese imports. Global markets interpreted this aggressive trade policy as a stagflationary signal—likely to increase consumer costs while dampening global trade volumes. Bitcoin, which had been peaking near $126,000, plunged to approximately $104,000 immediately following the news, introducing a pervasive sense of macro-uncertainty.
The $19 Billion Liquidation Wave
This event triggered one of the most severe systemic crises in crypto market history. In a single 24-hour window, the ecosystem witnessed a liquidation wave totaling roughly $19 billion to $20 billion. Roughly 1.6 million traders saw their positions forcibly closed. This event structurally damaged the leverage profile of the market, leaving order books thin and fragile heading into November.
III. Market Structure Failure: The November Liquidity Crisis
While the October crash was macro-driven, the November collapse was a failure of internal market mechanics. The ecosystem had built up systemic risks reminiscent of the 2022 leverage crisis, specifically regarding “circular lending” and synthetic assets.
The “Liquidity Singularity” and Order Book Vacuum
By mid-November, market makers slashed risk exposure and withdrew from order books, creating a “Liquidity Singularity.” In this vacuum, relatively small sell orders caused outsized price impacts. Major exchanges struggled under the load, with several decentralized platforms going offline during peak volatility.
The Return of Circular Lending: The USDe De-peg
A critical driver of the crash was the instability of “wrapped” and synthetic assets. Investors had engaged in strategies mortgaging synthetic stablecoins like USDe to borrow other assets, amplifying principal nearly four times for high yields. When the market turned, the collateral value collapsed.
USDe briefly lost its peg to the U.S. dollar, falling to $0.65 on some exchanges. This de-peg triggered a massive wave of automatic liquidations. This incident highlights the critical importance of using time-tested stablecoins. For businesses, relying on a robust USDT payment gateway that utilizes Tether (USDT-TRC20) or USDC-ERC20 ensures stability and avoids the risks associated with experimental synthetic assets.
IV. The Institutional Exodus: ETF Flows and Hedge Fund Signals
Throughout 2024, the bullish narrative was driven by “Wall Street Adoption” via Spot Bitcoin ETFs. In November 2025, this narrative inverted.
The BlackRock Reversal
Institutional sentiment shifted dramatically. On November 20 alone, U.S. Spot Bitcoin ETFs recorded over $1.1 billion in net outflows. Over the month, these products saw net outflows exceeding $3 billion. When investors sell ETF shares, issuers must sell the underlying Bitcoin, adding immense sell-side volume to the spot market.
Goldman Sachs and the “Trend-Following” Sell Signal
Goldman Sachs reported that the S&P 500 breached critical technical levels, acting as a “green light” for trend-following hedge funds (CTAs) to initiate short positions. As Bitcoin increasingly trades as a high-beta technology stock, these algorithmic sell programs spilled over into crypto. For a deeper dive into institutional movements, recent reports from CoinShares provide excellent data on these flow dynamics.
V. On-Chain Forensics: The Battle of the Whales
While price charts show the result of selling, on-chain analysis reveals who was selling. November was characterized by a distinct divergence between different cohorts of holders.
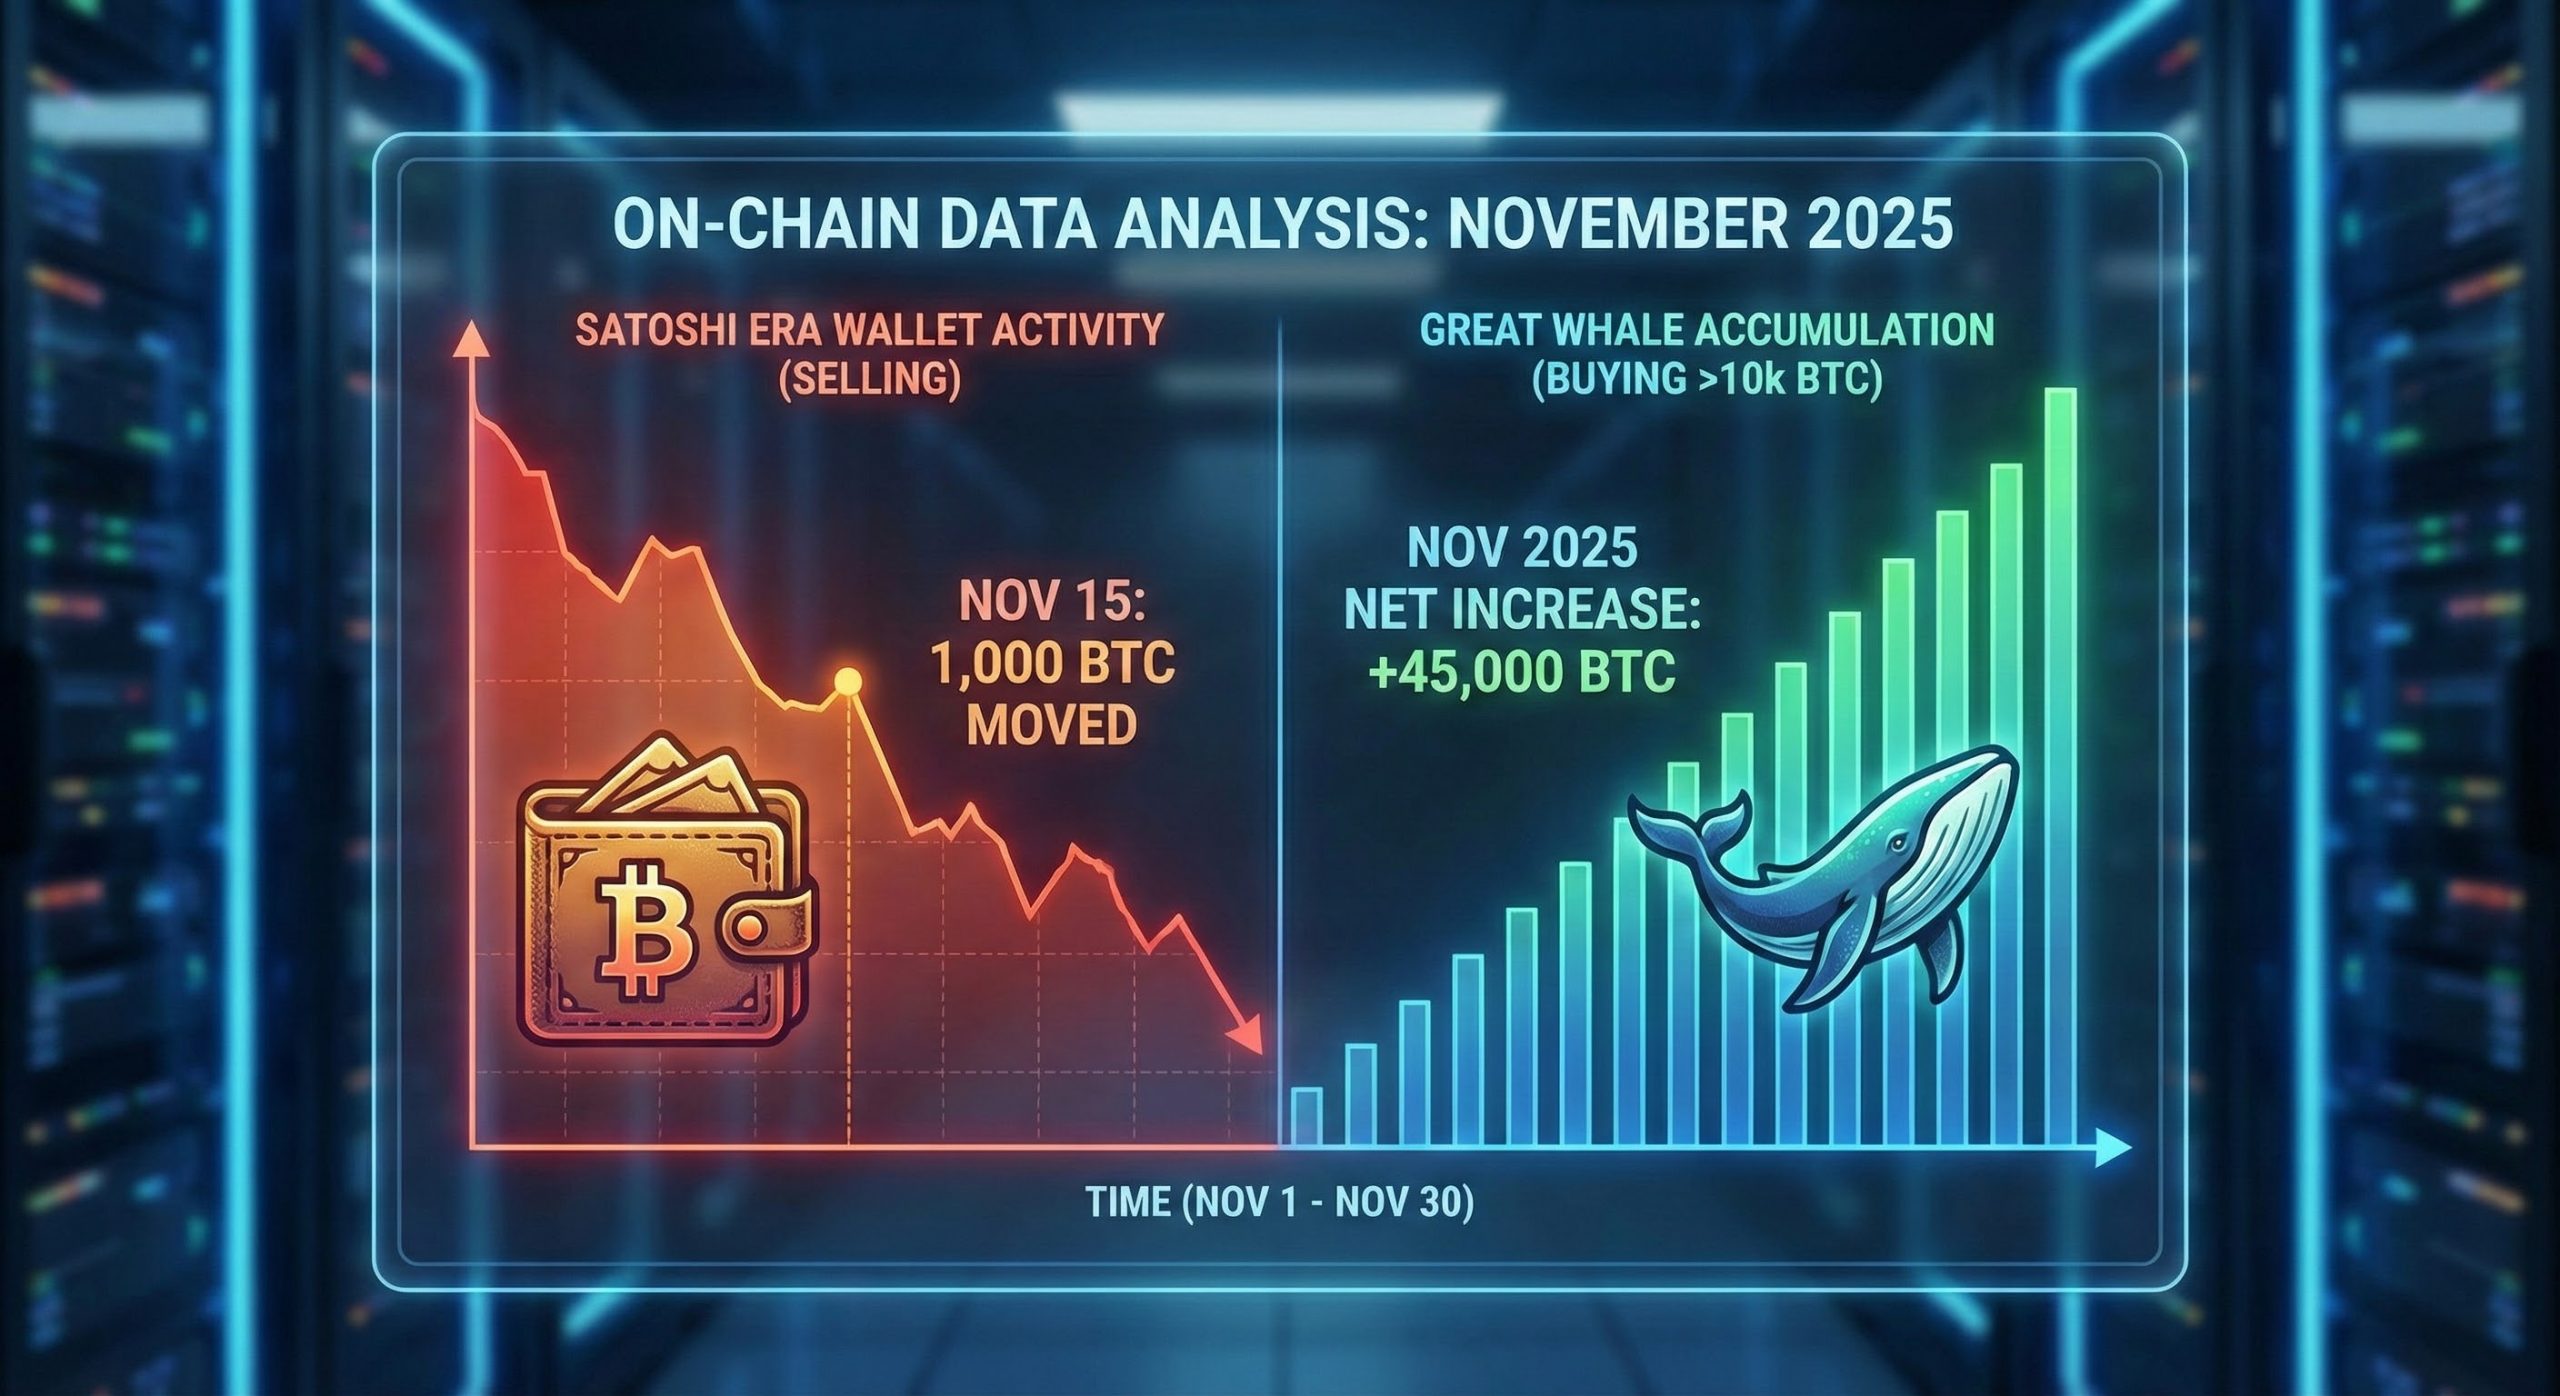
The “Satoshi-Era” Capitulation
A significant psychological blow was dealt when on-chain forensics identified a “Satoshi-era” whale—a wallet dating back to 2011—liquidating a position valued at approximately $1.5 billion. When “ancient” coins move, it often shatters the resolve of newer entrants, shifting sentiment from greed to extreme fear.
Accumulation by the “Great Whales”
Conversely, the picture was not uniformly bearish. Data indicates that “Great Whales” (holding >10k BTC) increased their cumulative holdings by 36,000 BTC during the dip. Furthermore, sovereign accumulation continued, with El Salvador purchasing an additional $100 million in Bitcoin. This suggests a transfer of wealth from early individual adopters to institutional and sovereign entities.
VI. Macroeconomic Convergence: The “No Hiring, No Firing” Stasis
Bitcoin’s price action cannot be isolated from the U.S. economic context. A partial government shutdown created a “data blindness” for the Federal Reserve, while the labor market entered a state of “no hiring, no firing” stasis. In this high-yield environment, non-interest-bearing assets like Bitcoin became relatively less attractive.
Additionally, the unwinding of the “AI Trade” acted as an anchor. As stocks like Nvidia saw volatility, the “risk-off” sentiment was contagious. For freelancers and agencies working in these tech sectors, using crypto invoices became a vital tool to ensure payments were secured quickly before market volatility could impact the value of their contracts.
VII. Technical Analysis: The Death Cross
From a technical perspective, the damage inflicted on Bitcoin’s chart in November 2025 altered the medium-term outlook.
The “Death Cross” Confirmation
On November 18, Bitcoin confirmed a “death cross,” where the 50-day moving average crosses below the 200-day moving average. Historically associated with bear markets, this signal exacerbated negative sentiment.
Critical Support Levels: The $80,000 – $82,000 zone (the “April Lows”) is currently acting as the line in the sand. A failure here could open liquidity zones as low as $74,000.
VIII. Future Outlook: 2026 and the Path to Maturation
Despite the gloom, long-term projections remain divergent. Financial giants like Fidelity Digital Assets argue that Bitcoin is maturing into a distinct asset class and that 2026 will see deeper integration through “crypto-staked ETFs.”
Institutional Price Targets
Assuming a recovery in Q1 2026, major institutions maintain relatively bullish medium-term targets:
- Standard Chartered: While their year-end targets were missed, the thesis of supply scarcity remains.
- JP Morgan: Suggests a “fair value” of roughly $170,000 is achievable over a 6-12 month horizon as liquidity returns.
- Consensus View: If Bitcoin defends the $75k-$80k zone, a recovery toward $120,000 is plausible in 2026.
As the market matures, merchants accepting ETH payments and other major cryptocurrencies are likely to see increased stability, driven by the resumption of Federal Reserve rate cuts.
IX. Expert Commentary: The “Ricky” Perspective
The events of November 2025 should not be viewed as a funeral for Bitcoin, but rather as a necessary forest fire. The run-up to $126,000 was fueled by unsustainable leverage and “tourist capital.” The subsequent flush has incinerated the froth, leaving a healthier market structure.
The current “Extreme Fear” sentiment is a classic contrarian signal. The structural integrity of the Bitcoin network remains completely unaffected by tariff policies. The transfer of coins from leveraged speculators to sovereign nations is a hallmark of a bottoming process. With the RSI at deep oversold levels, the “Smart Money” is likely seeing a generational accumulation opportunity.
The market is currently mispricing the “Tariff Shock.” Once the initial liquidity shock subsides and central banks are forced to inject liquidity, Bitcoin will likely decouple from equities and resume its ascent. The fundamentals point to an asset primed for a mean reversion in Q1 2026.
X. Conclusion
The Bitcoin crash of November 2025 was a multifaceted event driven by policy errors, market fragility, and institutional retrenchment. However, the “Liquidity Singularity” also revealed the resilience of the sector. Despite exchange outages and synthetic de-pegs, the core network continued to produce blocks without interruption.
As the market pivots to 2026, the focus will shift from the immediate pain of deleveraging to long-term trends of maturation. For businesses, this is the time to build robust infrastructure. Explore our integrations collection to ensure your business is ready to accept crypto payments securely and efficiently when the inevitable market recovery begins.